
How Data Analytics Makes Commercial Cleaning More Efficient and Cost‑Effective
Data-driven commercial cleaning combines sensors, analytics, and workflow automation to turn everyday signals into prioritized cleaning tasks that cut labor and supply costs. For businesses in Metro Detroit, including Macomb, Oakland, and Wayne Counties, this approach offers a significant competitive advantage. In this guide you’ll see the components of a practical data-driven cleaning program, how IoT sensors and occupancy data create dynamic schedules, and how predictive maintenance plus focused KPIs improve hygiene and reduce expenses. Facility teams face constant pressure to lower labor and supply spend while keeping spaces clean and compliant; cleaning performance data bridges that gap by aligning effort with real usage. Below we map the technology stack (sensors, data feeds, dashboards), explain predictive maintenance and janitorial forecasting, and highlight the KPIs that matter — plus how to turn them into SLAs and measurable ROI. Throughout we reference phrases like data-driven cleaning, smart cleaning technology, occupancy-based cleaning, and cleaning performance data so decision-makers can follow the path from insight to action.
What is Data-Driven Commercial Cleaning and Why Does It Matter?
Data-driven commercial cleaning means collecting operational signals from sensors and systems, analyzing them, and turning the insights into targeted tasks that save staff time and materials. It brings together data collection (sensors, audits, occupant feedback), analytics (dashboards, occupancy models, simple predictive rules), and execution (mobile task apps, dynamic routes) to deliver results like lower cost per square meter and higher hygiene scores. Instead of fixed, time-based checklists, we move to usage-based cleaning that reduces unnecessary visits and focuses on high-traffic hotspots. This approach matters because it ties commercial cleaning work directly to facility use, compliance needs, and occupant satisfaction — making hygiene investments defensible and measurable. Knowing these components helps facility teams evaluate sensors, analytics platforms, and workflows that form a coherent, actionable program.
How Does Data Analytics Transform Commercial Cleaning Operations?
Analytics replace static schedules with demand-driven rules that improve responsiveness and resource allocation. Systems ingest occupancy counts, dispenser activations, and historical cleaning logs to recommend task priorities, route adjustments, and staffing changes in near real time. For example, a restroom that sees a lunchtime spike in dispenser activations can be added to a daytime route automatically, while low-use areas get fewer visits — trimming labor without sacrificing cleanliness. Analytics also show compliance and SLA performance through heatmaps and trend reports, making it clear where to focus attention. Those operational shifts cut waste and support steady budgeting; the next section outlines the specific business benefits smart cleaning technology brings.
What Are the Key Benefits of Smart Cleaning Technology for Businesses?
Smart cleaning technology delivers measurable business results: improved labor efficiency, lower supply spend, clear compliance evidence, and greater occupant confidence. It routes staff to areas that need attention, reduces duplicate visits, and documents task completion via mobile apps and dashboards. Smart dispensers and usage forecasting curb consumable waste and help schedule refills to match real demand, lowering purchase and inventory costs. For office cleaning companies, this means a more efficient operation and a healthier workspace. And because actions are timestamped and scored, you get audit-ready proof of hygiene and SLA compliance to share with stakeholders. Put simply: better hygiene, a lower cost per area, and stronger proof of performance.
- Targeted route changes reduce labor while increasing productivity.
- Smart dispensers and forecasting cut supply waste and expense.
- Dashboards create clear evidence of compliance and boost occupant trust.
Those benefits lead naturally to the technical layer: the sensors and devices that create the signals analytics use.
How Do IoT Sensors Enable Smart Cleaning in Commercial Facilities?
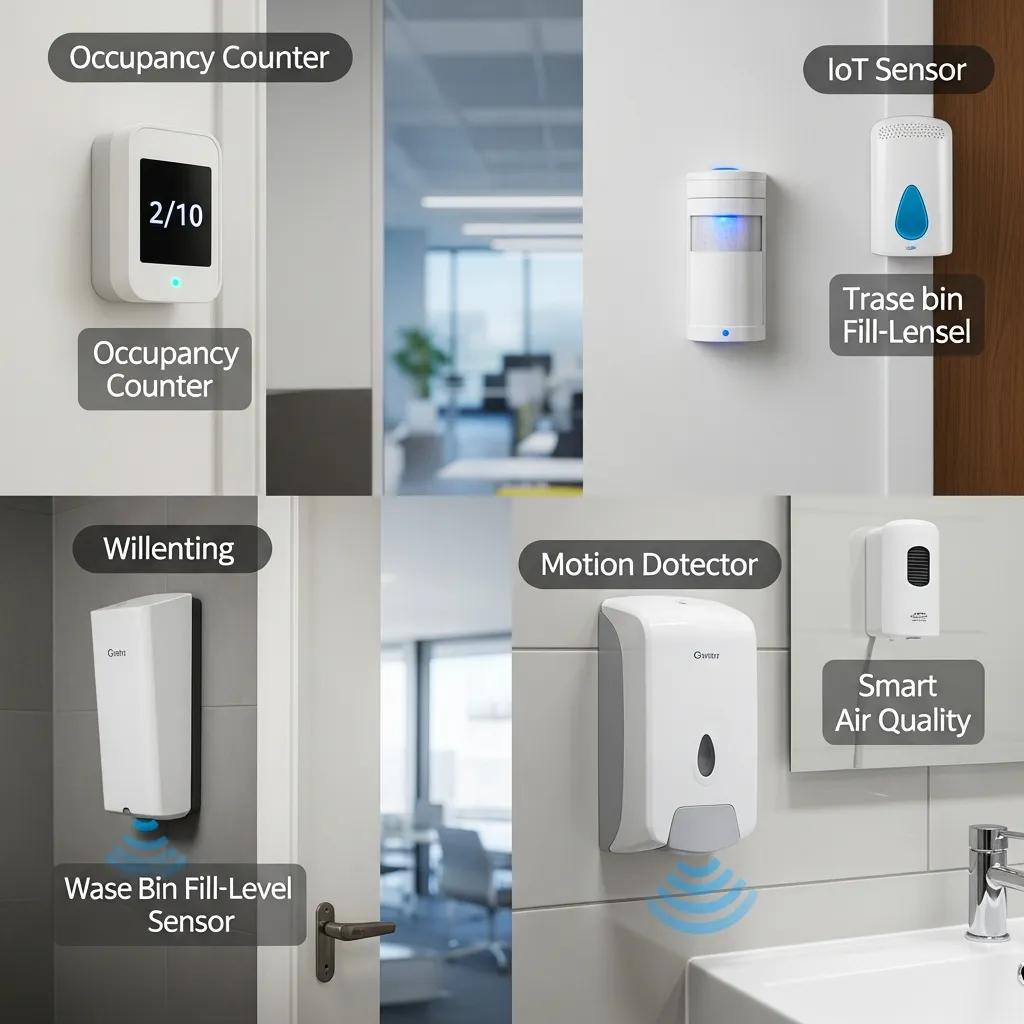
IoT sensors are the data layer that links physical usage to cleaning decisions by tracking occupancy, dispenser use, environmental conditions, and equipment status. Sensors convert real-world events into data feeds that drive occupancy-based rules, trigger alerts, and populate performance dashboards managers use to optimize routes and schedules. Successful deployments consider sensor placement, connectivity, privacy, and integration with workforce tools so data is reliable and actionable. The table below compares common sensor types, what they measure, and practical cleaning use-cases to help teams prioritize based on goals and facility layout.
Quick look: this table maps common IoT devices to their primary measurement and a practical cleaning use-case.
| Sensor Type | Measures | Cleaning Use-Case |
|---|---|---|
| Occupancy / People Counters | Footfall and zone occupancy | Adjust cleaning frequency for high-traffic zones |
| Motion Sensors | Real-time presence and activity | Add checkpoints to routes when motion indicates recent use |
| Smart Dispensers | Soap, paper, sanitizer usage | Schedule refills and target restroom visits based on activations |
| Air Quality Sensors | Particulate matter, VOCs | Flag HVAC checks or targeted fogging for better hygiene |
| Equipment Telemetry | Run-time, fault alerts | Trigger preventive servicing of floor machines and vacuums |
This comparison shows how different sensors create actionable signals; next we catalog common devices and the specific data they produce.
What Types of IoT Devices Collect Data for Cleaning Optimization?
Common devices include occupancy counters, motion detectors, smart dispensers, air quality monitors, and equipment telemetry modules. Each produces data that maps directly to cleaning decisions. Occupancy and motion give counts and dwell-time metrics for usage-based routing; dispensers record activations to reveal consumable depletion and restroom demand; air quality monitors detect particle or VOC spikes that suggest extra disinfection or HVAC attention; and equipment telemetry reports runtime and faults for predictive maintenance. Combined, these sources feed analytics platforms that produce heatmaps, alerts, and optimized routes. Knowing device outputs helps teams choose sensors that solve their specific pain points and integrate with mobile workforce apps and dashboards.
Quick reference: the table below summarizes sensor entities, key attributes, and typical outcomes when used in cleaning programs.
| Device | Key Attribute | Practical Outcome |
|---|---|---|
| Occupancy Counter | People per hour | Adjust cleaning frequency dynamically |
| Smart Dispenser | Activations per day | Plan refills and forecast consumable needs |
| Air Quality Monitor | PM2.5 / VOC levels | Trigger fogging or HVAC inspections |
| Equipment Sensor | Runtime / Faults | Schedule preventive maintenance for floor equipment |
Summary: sensor attributes directly predict cleaning actions and outcomes; next we explain how real-time occupancy data converts into schedules.
McCoy Maintenance is a family-owned commercial cleaning service provider based in Eastpointe, MI, serving Macomb, Oakland, and Metro Detroit. We offer office cleaning and janitorial services, commercial and residential carpet and upholstery cleaning, floor care, fogging, and construction cleanups. Our focus is reliability, professionalism, tailored service, and 100% satisfaction. Founded in 1984.
How Does Real-Time Occupancy Data Improve Cleaning Schedules?
Real-time occupancy data enables rule-based triggers and prioritization so staff focus on areas with verified use instead of following fixed intervals. Systems can auto-assign a cleaning task to a nearby team member when a zone hits a threshold of entries or dwell time, reducing response time and concentrating effort on hotspots. That cuts redundant visits in low-use areas and reallocates labor where it has the biggest hygiene impact, lowering cost per cleaned area without sacrificing standards. Occupancy-driven metrics also feed staffing models so managers can adjust shifts based on real patterns. With occupancy analytics, facilities gain agility and documented evidence for SLA performance.
What is Predictive Maintenance and How Does It Enhance Janitorial Services?
Predictive maintenance uses historical logs, sensor alerts, and equipment telemetry to forecast when machines or supplies need service or replacement, reducing downtime and extending asset life. The approach applies analytics — from simple threshold rules to machine learning models — to spot likely failures before they happen, allowing scheduled interventions instead of emergency repairs. Results include fewer interruptions, leaner parts inventory, and smarter maintenance budgets because servicing occurs when it’s needed, not reactively. That means better uptime for floor buffers and scrubbers, fewer surprises for janitorial teams, and smoother daily operations. The table below links common data sources to predicted outcomes so managers can see the value clearly.
Quick look: this EAV-style table maps data sources to likely signals and the predicted outcomes for maintenance planning.
| Data Source | Typical Signal | Predicted Outcome |
|---|---|---|
| Equipment Runtime Logs | High cumulative hours | Schedule preventive motor inspection |
| Sensor Error Alerts | Fault codes | Replace worn components before failure |
| Maintenance History | Short service intervals | Review for equipment replacement planning |
Summary: mapping signals to outcomes helps teams move from reactive fixes to scheduled maintenance that preserves assets and reduces downtime; next we detail forecasting methods for cleaning needs.
How Can Data Forecast Cleaning Needs and Equipment Maintenance?
Forecasts use trend analysis and threshold rules on telemetry, audit results, and dispenser activity to produce prioritized action lists and maintenance windows. For example, a steady rise in dispenser activations over several weeks can signal increased restroom demand — prompting more frequent visits or extra consumables — while rising vibration on a machine can predict bearing failure and trigger scheduled service. Forecasting ranges from simple moving averages to regression models that account for seasonality and usage patterns. These forecasts let you plan interventions, reduce emergency responses, and align procurement with predictable demand. As forecasts improve, managers can shift budget from contingency to planned upgrades and efficiency projects.
What Are the Operational Advantages of Predictive Cleaning Maintenance?
Predictive maintenance lowers emergency repairs, extends equipment life, and creates predictable budgets and higher on-time completion rates for janitorial teams. Anticipating when vacuums, mop systems, or floor maintenance equipment needs service prevents productivity loss from unexpected downtime. It also supports parts and consumable planning so inventory orders are timed and sized to actual wear. Those gains boost staff productivity, lower total cost of ownership for cleaning assets, and make operations more reliable and measurable against KPIs and SLAs.
How Can Cleaning Performance Metrics and KPIs Drive Operational Efficiency?
Cleaning performance metrics and KPIs are the backbone of continuous improvement — they turn raw data into targets, operational changes, and measurable ROI. Core KPIs include cleanliness audit scores, incident response times, utilization metrics (occupancy per visit), and cost per cleaned area. These come from sensors, audits, and occupant feedback, then appear on dashboards for trend analysis and action. A regular reporting cadence — daily dashboards and weekly trend reports — helps managers spot deviations and correct course, for example by rerouting staff or changing frequencies. Linking KPIs to SLAs builds accountability and lets procurement compare service models on real performance. The table below summarizes key KPIs, how to measure them, and sample benchmarks to help set realistic targets.
Quick reference: core KPIs, how they’re measured, and example benchmark ranges to guide targets.
| KPI | How It’s Measured | Benchmark / Example Value |
|---|---|---|
| Cleanliness Score | Audits / Visual inspections | 85–95% target score |
| Response Time | Time from alert to completion | < 30 minutes for high-priority areas |
| Cost per sqm | Total cleaning cost / area | Varies by market; track trend improvements |
| Dispenser Refill Rate | Activations per refill | Benchmark by restroom type and footfall |
Summary: these KPIs create a shared language for improvement and give clear thresholds for operational change; the next section explains choosing and tracking KPIs in practice.
McCoy Maintenance is a family-owned commercial cleaning service provider based in Eastpointe, MI, serving Macomb, Oakland, and Metro Detroit. We specialize in office cleaning, janitorial services, commercial carpet and upholstery cleaning, floor maintenance, fogging, and construction cleanups. Our team delivers reliable, professional, customized service with a commitment to 100 percent satisfaction. Founded in 1984. Learn more about our commercial cleaning services in Metro Detroit.
Which KPIs Are Essential for Measuring Cleaning Quality and ROI?
Essential KPIs for quality and ROI include cleanliness audit score, response time to incidents, utilization per visit, and cost per cleaned area. Cleanliness audits give a consistent quality metric using a standard checklist. Response time tracks how quickly teams handle urgent issues flagged by sensors or occupants. Utilization per visit compares occupancy data with visit counts to ensure staffing matches real use. Cost per cleaned area ties expenses to outcomes so you can calculate ROI. Monitoring these KPIs over time lets managers test changes — like occupancy-based routing — and measure the financial and service impact.
Compact reference: the table below ties each metric to its measurement method and a sample benchmark.
| Metric | Measurement Method | Benchmark Example |
|---|---|---|
| Cleanliness Audit | Standardized checklist | 90% target |
| Response Time | System timestamps | < 30 minutes |
| Cost per sqm | Accounting / Area data | Decreasing trend preferred |
Summary: these KPI mappings help turn performance goals into contract terms and operational routines; next we show how managers act on these insights.
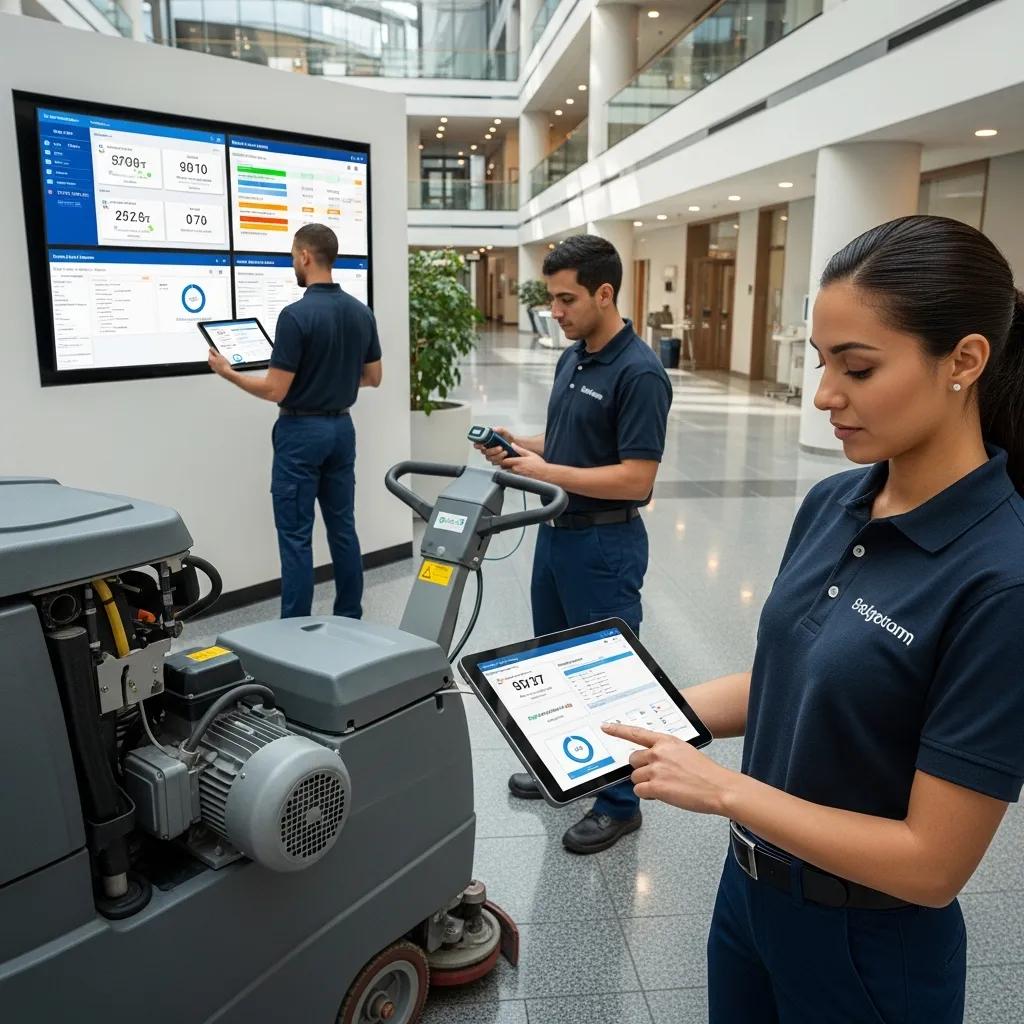
How Do Facility Managers Use Analytics to Improve Service Delivery?
Managers use analytics to turn KPI trends into specific operational changes — rerouting staff, shifting schedules, and refining procurement — driving continuous improvement. Analytics reveal heatmaps and timing patterns, such as midday peaks or weekly shortfalls, so managers can reassign staff or add targeted tasks at the right times. Data also supports smarter purchasing by revealing consumption trends that allow bulk buying and fewer emergency orders. Managers can run short experiments: adjust a schedule, watch KPI responses, and iterate until performance and costs improve. Treating analytics as the decision engine helps prove ROI and tighten SLA compliance over time.
- Analytics enable targeted route changes that improve completion rates.
- Analytics cut over-servicing and free staff for high-priority work.
- Analytics support evidence-based procurement and budgeting.
Those practical scenarios lead into the business-level benefits for property and facility managers.
What Are the Benefits of Data Analytics for Commercial Property and Facility Managers?
Data analytics delivers three clear business benefits: measurable cost savings, stronger hygiene compliance, and improved occupant health and satisfaction — all of which support tenant retention and building reputation. Analytics align cleaning effort with real use to reduce labor and supply costs, provide an auditable trail for inspections and certifications, and demonstrate improvements in occupant experience through cleanliness scores and response metrics. For Metro Detroit property managers, data-driven cleaning helps address local cost pressures while improving satisfaction in office and mixed-use properties across Macomb and Oakland counties. Adopting analytics also lets managers negotiate service contracts based on measurable SLAs rather than assumed frequencies. The subsections that follow break down cost and hygiene impacts and present the local-market case for adoption.
Quick list: core benefits facility teams can expect when they apply cleaning performance data.
- Cost Reduction: Demand-based routing and scheduling cut unnecessary labor and supply costs.
- Compliance and Evidence: Dashboards and audit logs supply documentation for standards and inspections.
- Occupant Confidence: Verified cleanliness and fast responses improve tenant and employee satisfaction.
Summary: these benefits form a straightforward value proposition for managers evaluating smart cleaning investments; next we explain how cost savings and hygiene gains occur.
How Does Data-Driven Cleaning Reduce Costs and Enhance Hygiene?
Data-driven cleaning cuts redundant visits, optimizes supply orders, and boosts staff productivity — while improving hygiene by focusing on areas with the highest contamination risk. Measuring usage and routing staff to hotspots reduces time spent in underused zones and increases attention to high-touch surfaces and restrooms. Dispenser telemetry and consumption trends help lower inventory costs and waste. Time-stamped tasks, audit scores, and sensor logs provide the documentation needed for regulatory or client requirements, reducing liability and building trust. Those operational and financial pathways form the core of the business case for analytics-based cleaning.
Why Should Metro Detroit Businesses Adopt Smart Cleaning Solutions?
Metro Detroit businesses should consider smart cleaning because local facility types — office parks, industrial sites, and mixed-use properties in areas like Troy, Royal Oak, and Sterling Heights — face tight operating budgets and tenant expectations for measurable cleanliness. Smart cleaning helps managers respond to variable occupancy after the pandemic, lower cleaning overhead tied to uncertain use, and show care for tenant health through documented KPIs. Early adopters also gain a market edge by demonstrating proactive, evidence-based building management. For local managers choosing providers, the right combination of analytics and reliable service execution is the practical step toward lower operating costs and happier tenants.
McCoy Maintenance is a family-owned commercial cleaning service provider based in Eastpointe, MI, serving Macomb, Oakland, and Metro Detroit. We offer office cleaning, janitorial services, commercial and residential carpet and upholstery cleaning, floor maintenance, fogging, and construction cleaning. Our promise is reliable, professional, customized service with 100 percent satisfaction. Founded in 1984.
- Operational Efficiency: Deploy occupancy-based routes and predictive maintenance.
- Financial Clarity: Use KPIs to make cleaning a measurable budget line with clear ROI.
- Competitive Positioning: Promote verified cleaning performance to keep and attract tenants.
Summary: Metro Detroit organizations that pair sensor data, predictive maintenance, and KPI-driven management will see real efficiency gains and better tenant outcomes.
McCoy Maintenance is a family-owned commercial cleaning service provider based in Eastpointe, MI, serving Macomb, Oakland, and Metro Detroit. We specialize in office and janitorial cleaning, carpet and upholstery care, floor maintenance, fogging, and construction cleaning. Our values are reliability, professionalism, tailored service, and a commitment to 100 percent satisfaction. Founded in 1984.
Frequently Asked Questions
What role does data analytics play in improving cleaning schedules?
Data analytics helps move cleaning from fixed timetables to demand-driven schedules. By analyzing real-time occupancy and usage patterns, analytics ensure tasks are assigned where they’ll have the most impact. High-traffic zones get more attention, low-use areas get fewer visits, and overall resources are used more efficiently — which delivers cost savings and better hygiene.
How can predictive maintenance impact the overall cleaning process?
Predictive maintenance keeps equipment running and reduces surprise downtime. By reviewing usage histories and sensor alerts, managers can schedule servicing or part replacements before machines fail. That minimizes disruptions, extends equipment life, and helps janitorial teams maintain steady service levels.
What are the challenges of implementing IoT sensors in commercial cleaning?
Common challenges include choosing the right sensor locations, ensuring reliable connectivity, integrating with existing systems, and addressing privacy concerns. Careful planning and clear use cases are essential so collected data is accurate, actionable, and compliant with privacy expectations.
How do cleaning performance metrics influence staff training and development?
Metrics provide objective feedback that guides training. Cleanliness scores, response times, and audit results highlight where staff need more coaching or process changes. Targeted training based on data helps teams work smarter and improves both performance and job satisfaction.
What is the significance of compliance documentation in commercial cleaning?
Compliance documentation proves cleaning standards are being met. Dashboards and audit logs create an auditable trail for inspections and client reviews, reduce liability, and strengthen trust with tenants and stakeholders. In competitive markets, strong documentation can be a deciding factor for prospective clients.
How can data-driven cleaning solutions enhance tenant satisfaction?
Data-driven solutions align cleaning with actual building use, so high-traffic areas stay cleaner and issues get resolved faster. Transparent performance metrics let tenants see that management is proactive about cleanliness — which builds confidence and helps retain occupants.
Conclusion
Adopting data-driven cleaning delivers real benefits: better operational efficiency, measurable cost savings, and stronger hygiene compliance. By pairing analytics with IoT and thoughtful workflows, facility managers can optimize schedules, allocate resources where they matter, and raise tenant satisfaction. If you’re ready to modernize cleaning operations for your business in Macomb, Oakland, or Wayne County, our team can help you design and implement a practical, results-oriented solution.